UGC NET Paper1 Previous Year Solved Papers MCQ - 24th June 2019 Evening Shift

Consider the following table that shows the production of fertilizers by a company (in 10000 tonnes) during the year 2011 to 2018. Answer the question based on the data contained in the table:

Year20112012201320142015201620172018
Production
of
Fertilizers:
35 50705575608590

Correct AnswerOption A
Rate difficulty Rate difficulty:
Choose a difficulty.
Increase in production of fertilizers in 2018 compared to 2011 = 90 - 35 = 55
Percentage increase = 55/35 X 100 = 157%
Cancel reply

Your email address will not be published. Required fields are marked *


Cancel reply

Your email address will not be published. Required fields are marked *

Consider the following table that shows the production of fertilizers by a company (in 10000 tonnes) during the year 2011 to 2018. Answer the question based on the data contained in the table:

Year20112012201320142015201620172018
Production
of
Fertilizers:
35 50705575608590

Correct AnswerOption C
Rate difficulty Rate difficulty:
Choose a difficulty.
Share this question
Share:
24 june evening
Cancel reply

Your email address will not be published. Required fields are marked *


Cancel reply

Your email address will not be published. Required fields are marked *

Consider the following table that shows the production of fertilizers by a company (in 10000 tonnes) during the year 2011 to 2018. Answer the question based on the data contained in the table:

Year20112012201320142015201620172018
Production
of
Fertilizers:
35 50705575608590

Correct AnswerOption B
Rate difficulty Rate difficulty:
Choose a difficulty.
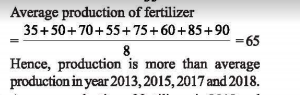
Average production of fertilizers in 2012 and 2013
(50 + 70)/2 = 60
Average production of fertilizers in 2011 and 2017
(35 + 85)/2 = 60
Cancel reply

Your email address will not be published. Required fields are marked *


Cancel reply

Your email address will not be published. Required fields are marked *

Consider the following table that shows the production of fertilizers by a company (in 10000 tonnes) during the year 2011 to 2018. Answer the question based on the data contained in the table:

Year20112012201320142015201620172018
Production
of
Fertilizers:
35 50705575608590

Correct AnswerOption A
Rate difficulty Rate difficulty:
Choose a difficulty.
24 JUNE EVENING
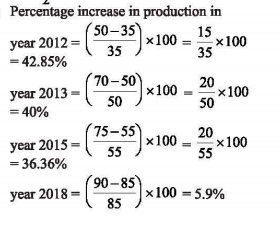
Hence, percentage increase is maximum in year 2012.
Cancel reply

Your email address will not be published. Required fields are marked *


Cancel reply

Your email address will not be published. Required fields are marked *

Consider the following table that shows the production of fertilizers by a company (in 10000 tonnes) during the year 2011 to 2018. Answer the question based on the data contained in the table:

Year20112012201320142015201620172018
Production
of
Fertilizers:
35 50705575608590

Correct AnswerOption B
Rate difficulty Rate difficulty:
Choose a difficulty.
24 june evening
Cancel reply

Your email address will not be published. Required fields are marked *


Cancel reply

Your email address will not be published. Required fields are marked *

Why Practice with Avatto?

High Quality MCQsExam-focused questions with accurate answers
Detailed ExplanationsStep-by-step explanations to enhance learning
Latest Exam PatternBased on updated syllabus and pattern
Performance AnalyticsTrack performance and improve weak areas
100% Free PracticePractice unlimited questions for free
Boost Your PreparationAttempt mock tests, previous year papers and topic-wise quizzes.Explore All Tests →