Data Interpretation MCQ - Bar Graph

Instructions:

Directions: The bar chart showing the food production in India during 1975 to 1983 is shown in the following figure. Answer the questions below
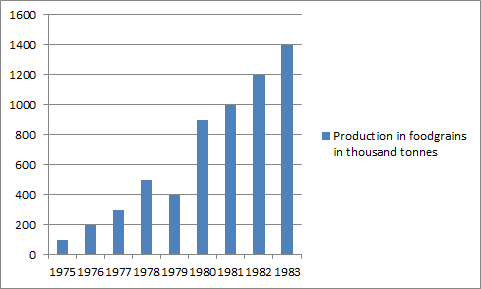
   Considering the measures given on the Y-axis, the production figures must be related to

Correct AnswerOption D
Rate difficulty Rate difficulty:
Choose a difficulty.
Cancel reply

Your email address will not be published. Required fields are marked *


Cancel reply

Your email address will not be published. Required fields are marked *

Instructions:

Directions: The bar chart showing the food production in India during 1975 to 1983 is shown in the following figure. Answer the questions below

   Considering the measures given on the Y-axis, the production figures must be related to
Correct AnswerOption D
Rate difficulty Rate difficulty:
Choose a difficulty.
Share this question
Share:
Cancel reply

Your email address will not be published. Required fields are marked *


Cancel reply

Your email address will not be published. Required fields are marked *

Instructions:

Directions: The bar chart showing the food production in India during 1975 to 1983 is shown in the following figure. Answer the questions below

   Considering the measures given on the Y-axis, the production figures must be related to
Correct AnswerOption C
Rate difficulty Rate difficulty:
Choose a difficulty.
Cancel reply

Your email address will not be published. Required fields are marked *


Cancel reply

Your email address will not be published. Required fields are marked *

Instructions:

Directions: The bar chart showing the food production in India during 1975 to 1983 is shown in the following figure. Answer the questions below

   Considering the measures given on the Y-axis, the production figures must be related to
Correct AnswerOption D
Rate difficulty Rate difficulty:
Choose a difficulty.
Cancel reply

Your email address will not be published. Required fields are marked *


Cancel reply

Your email address will not be published. Required fields are marked *

Instructions:

Directions: The bar chart showing the food production in India during 1975 to 1983 is shown in the following figure. Answer the questions below

   Considering the measures given on the Y-axis, the production figures must be related to
Correct AnswerOption B
Rate difficulty Rate difficulty:
Choose a difficulty.
Cancel reply

Your email address will not be published. Required fields are marked *


Cancel reply

Your email address will not be published. Required fields are marked *

Why Practice with Avatto?

High Quality MCQsExam-focused questions with accurate answers
Detailed ExplanationsStep-by-step explanations to enhance learning
Latest Exam PatternBased on updated syllabus and pattern
Performance AnalyticsTrack performance and improve weak areas
100% Free PracticePractice unlimited questions for free