
Data Interpretation MCQ - Bar Graph
Instructions:
Study the following graph and answer the question 66-70 following it
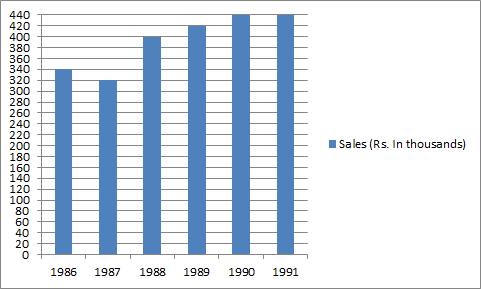


Instructions:
Study the following graph and answer the question 66-70 following it
Instructions:
Study the following graph and answer the question 66-70 following it
Increased in 1989 over 1988 = (20/400)*100 = 5
Increase in 1990 over 1989 = (20/400)*100 = 4.76
Instructions:
Study the following graph and answer the question 66-70 following it
Instructions:
Study the following graph and answer the question 66-70 following it
