info@avatto.com
+91-9920808017
Instructions:
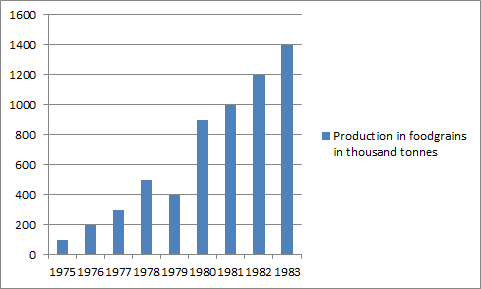
Directions: The bar chart showing the food production in India during 1975 to 1983 is shown in the following figure. Answer the questions below
the production of any of the cereals
the production of the cash crops
the production of any of the food items
total food production during the year
Your email address will not be published. Required fields are marked *
Report
Name
Email
Save my name and email in this browser for the next time I comment.
Comment *
Login with Facebook
Login with Google
Forgot your password?
Lost your password? Please enter your email address. You will receive mail with link to set new password.
Back to login
Saved in this browser. Nothing changes for anyone else.