


A quick observation of the chart shows that Hindus in 1991, 92, 93, and 94 were 30%, 55%, 60%, 45 % respectively
So, the maximum percentage was in 1993
Instructions:
Given below is a bar diagram and percentage of Hindus, Sikhs, and Muslims in a state during the years from 1991-1994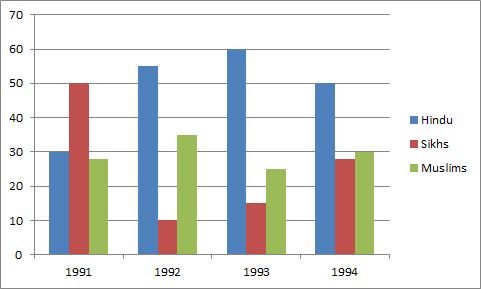
Study the above diagram and answer the following questions 26-28
So, the maximum percentage was in 1993
Instructions:
Given below is a bar diagram and percentage of Hindus, Sikhs, and Muslims in a state during the years from 1991-1994
Study the above diagram and answer the following questions 26-28
Instructions:
Given below is a bar diagram and percentage of Hindus, Sikhs, and Muslims in a state during the years from 1991-1994
Study the above diagram and answer the following questions 26-28
Saved in this browser. Nothing changes for anyone else.
