
Data Interpretation MCQ - Pie Chart
Instructions:
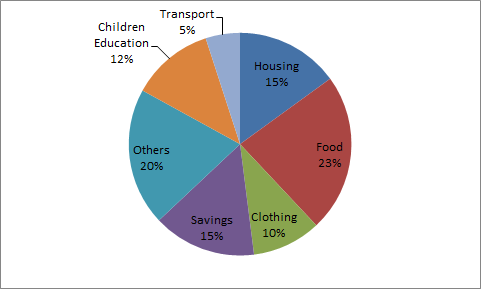
Directions. The circle graph given below shows the spending of a family on various items and its savings a year


Instructions:
Directions. The circle graph given below shows the spending of a family on various items and its savings a year
Instructions:
Directions. The circle graph given below shows the spending of a family on various items and its savings a year
Difference of expenditure on Housing & Transport = (15-5)% of Rs. 75000 = Rs. 7500
Instructions:
Directions. The circle graph given below shows the spending of a family on various items and its savings a year
Expenditure on food was more than that on clothing by
(23-10)% of Rs.75000 = Rs.9750
