PREVIOUS YEAR SOLVED PAPERS - November 2017


- Option : A
- Explanation : According to Sturge’s rule, the number of classes can be determined by the formula
k = 1 + 3.222 loge N
where k is the number of classes and loge N is the logarithm of the total number of observations.
17. Which one of the following is not the characteristics of normal distribution?
- Option : D
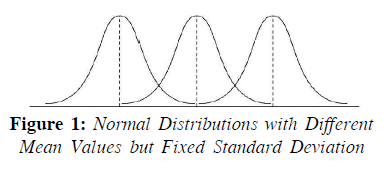
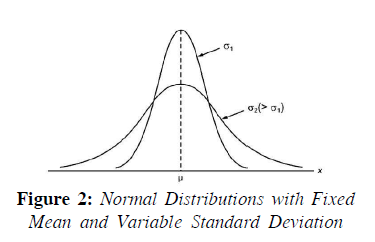
- Explanation : Characteristics of the Normal Probability Distribution: There is a family of normal distributions. Each normal distribution may have a different mean μ or standard deviation σ. A unique normal distribution may be defined by assigning specific values to the mean μ and standard deviation σ in the normal probability density function. Large value of σ reduce the height of the curve and increase the spread; small values of σ increase the height of the curve and reduce the spread. Figure 1 shows three normal distributions with different values of the mean μ and a fixed standard deviation σ, while in Figure 2 normal distributions are shown with different values of the standard deviation σ and a fixed mean μ.
From Figs. 1 and 2 the following characteristics of a normal distribution and its density function may be derived:
(i) For every pair of values of μ and σ, the curve of normal probability density function is bell shaped and symmetric.
(ii) The normal curve is symmetrical around a vertical line erected at the mean μ with respect to the area under it, that is, fifty per cent of the area of the curve lies on both sides of the mean and reflect the mirror image of the shape of the curve on both sides of the mean μ. This implies that the probability of any individual outcome above or below the mean will be same. Thus, for any normal random variable x,
P(x ≤ μ) = P(x ≥ μ) = 0.50
(iii) Since the normal curve is symmetric, the mean, median and mode for the normal distribution are equal because the highest value of the probability density function occurs when value of a random variable, x = μ.
(iv) The two tails of the normal curve extend to infinity in both directions and theoretically never touch the horizontal axis.
(v) The mean of the normal distribution may be negative, zero, or positive as shown in Fig. (1).
(vi) The mean μ determines the central location of the normal distribution, while standard deviation σ determines its spread. The larger the value of the standard deviation σ, the wider and flatter is the normal curve, thus showing more variability in the data, as shown in Fig. (2). Thus standard deviation σ determines the range of values that any random variable is likely to assume.
(vii) The area under the normal curve represents probabilities for the normal random variable, and therefore, the total area under the curve for the normal probability distribution is 1.
- Option : C
- Explanation : The parameters of the sampling distribution
are related to the parameters of the distribution
of data. The means of the two distributions
are equal to the same value. This will always
be the case for any unbiased estimate. An
unbiased estimate is equal to the population’s
parameter, on the average. This is reflected in
the sampling distribution by having the mean
equal to the parameter that is being estimated
(i.e., mean of the distribution of data).
The variances and standard deviations of the sampling distribution and distribution of data are related, but not equal to the same value. The sampling distribution is less dispersed than is the distribution of data. The reason for this is that the impact of extreme data values in a sample is offset by less extreme data values. Thus, estimates of the mean have less variation than do the data. How much less, depends on the number of observations in the sample. The greater the number of observations, the less variable the estimates. To emphasize the difference in dispersion between the sampling distribution and the distribution of data, the standard deviation of the sampling distribution is usually called the standard error.
20. Match the items of List-I with List-II; and choose the correct code of combination:
| List-I | List-II |
| (a) The Fundamentals of Top Management | (i) Peter F. Drucker |
| (b) Middle Management | (ii) R.C. Davis |
| (c) The Essence of Management | (iii) E.L.F. Brech |
| (d) Principles and Practice of Management | (iv) Mary Caushing Nile |
CODES
| (a) | (b) | (c) | (d) | |
| 1 | (ii) | (iv) | (iii) | (i) |
| 2 | (ii) | (iv) | (i) | (iii) |
| 3 | (ii) | (iii) | (i) | (iv) |
| 4 | (iii) | (iv) | (i) | (ii) |
