
Quantitative Methods MCQ - Quantitative Methods Section 2


42
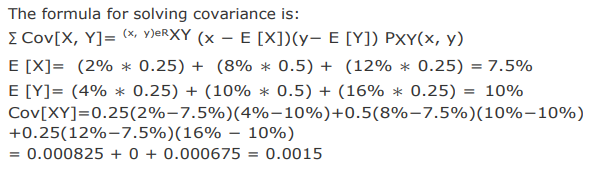
Two companies, Lemon Co. and Demon Co. have the following probability distributions in different economic situations:
| Scenario | P(Scenario) | Expected Returns of Lemon Co. | Expected Returns of Demon Co. |
| Recession | 0.25 | 2% | 4% |
| Normal | 0.5 | 8% | 10% |
| Boom | 0.25 | 12% | 16% |
The covariance of the expected returns for Lemon Co. and Demon Co. is closest to:
43
Two companies, Lemon Co. and Demon Co. have the following probability distributions in different economic situations:
| Scenario | P(Scenario) | Expected Returns of Lemon Co. | Expected Returns of Demon Co. |
| Recession | 0.25 | 2% | 4% |
| Normal | 0.5 | 8% | 10% |
| Boom | 0.25 | 12% | 16% |
The correlation coefficient of Lemon Co. and Demon Co. is closest to:
Fatima is incorrect because covariance may range from negative infinity to positive infinity. Taimour and Vishal are correct.
The correlation of 1.0 signifies that the securities are perfectly
positively correlated; it implies that they will move in the same
direction so the portfolio cannot benefit from diversification.
