


When a dice is rolled, since there are a finite number of outcomes, it is an
example of a discrete probability distribution. The continuous uniform
distribution is defined over a range from a lower limit ‘a’ to an upper limit ‘b’. A
normal distribution is symmetrical and bell-shaped.
Quantitative Methods MCQ - Quantitative Methods Section 2
The cumulative distribution function gives the probability that a random
variable X is less than or equal to a particular value x, P (X < x). Probability
function specifies probability that random variable takes on a specific value.
Probability density function is used for continuous random variables.
73
Discrete uniform probability distribution of net profits for a currency option on EURO (€) is as follows:
| Net Profit (€) | Probability |
| Net profit of 0 | 0.25 |
| Net profit of 2 or less | 0.50 |
| Net profit of 4 or less | 0.75 |
| Net profit of 6 or less | 1.00 |
The probability of a net profit greater than €2 and less than or equal to €6 is closest to:
P(X ≤ 6) = 1.0 and P(X ≤ 2) = 0.50. Therefore, P (2 ≤ X ≤ 6)
= 1.0 – 0.50 = 0.50.
Consider the tree diagram below: The probability of a price decrease is equal to the probability of a price change times the probability of a decrease given a change = 0.6 * 0.6 = 0.36.
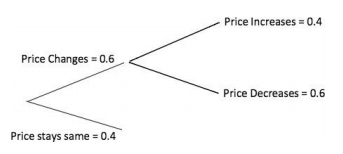 The probability of a price decrease is equal to the probability of a price change times the probability of a decrease given a change = 0.6 * 0.6 = 0.36.
The probability of a price decrease is equal to the probability of a price change times the probability of a decrease given a change = 0.6 * 0.6 = 0.36.
75
Ali, a CFA candidate, is evaluating a portfolio, which is composed of Fund A and Fund B. He has collected the following information:
| Fund A | Fund B | ||
| Portfolio weights (%) | 45 | 55 | |
| Expected returns (%) | 23 | 13 | |
| Standard deviations (%) | 14 | 6 | |
| Correlation between the returns of Fund X and Fund Y | 0.7 | ||
The portfolio standard deviation of the returns is closest to:
The portfolio standard deviation of the returns is calculated through
following formula:
 And covariance is calculated through following formula:
Cov(RARB)=ρ (RARB) σ (RA)σ(RB)
First calculate the covariance, Cov= 0.7 ∗ .14 ∗ .06 = 0.00588, then
enter values in the formula 1 for calculating portfolio standard
deviation, you should get portfolio standard deviation = 8.90%.
And covariance is calculated through following formula:
Cov(RARB)=ρ (RARB) σ (RA)σ(RB)
First calculate the covariance, Cov= 0.7 ∗ .14 ∗ .06 = 0.00588, then
enter values in the formula 1 for calculating portfolio standard
deviation, you should get portfolio standard deviation = 8.90%.
And covariance is calculated through following formula:
Cov(RARB)=ρ (RARB) σ (RA)σ(RB)
First calculate the covariance, Cov= 0.7 ∗ .14 ∗ .06 = 0.00588, then
enter values in the formula 1 for calculating portfolio standard
deviation, you should get portfolio standard deviation = 8.90%.