PREVIOUS YEAR SOLVED PAPERS - July 2018
| Price elasticity coefficient | Change in price | Change in Total Revenue | |
| A | Zero | Increase Decrease | Increase Decrease |
| B | Less than 1 | Increase Decrease | Decrease Increase |
| C | Equal to 1 | Increase Decrease | No change No change |
| D | More than 1 | Increase Decrease | Decrease Increase |


- Option : B
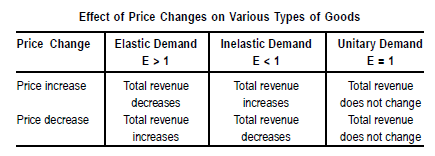
- Explanation : Relationship between Price Elasticity and Total Revenue: Total revenue from the sale of a good is equal to the price times the quantity. Price elasticity is an important concept because if demand is elastic and increase in sales price results in a decrease in total revenue for all producers. If demand is unitary total revenue remains the same if price changes, and total revenue increases if price is increased when demand is inelastic. These relationships are shown in the following table:
17. Which one of the following is not the basic property of indifference curves?
- Option : B
- Explanation : Properties of Indifference Curves: Indifference curves drawn for two normal substitute goods have the following four basic properties:
∎ Indifference curves have a negative slope;
∎ Indifference curves are convex to the origin;
∎ Indifference curves do not intersect nor are they tangent to one another;
∎ Upper indifference curves indicate a higher level of satisfaction.
These properties of indifference curves, in fact, reveal the consumer’s behaviour, his choices and preferences. They are, therefore, very important in the modern theory of consumer behaviour.
| List-I | List-II |
| (a) Economies of scale | (i) arise with lower average costs of manufacturing when two complementary products are produced by a single firm |
| (b) Internal economies | (ii) Mean lowering of costs of production by producing in bulk |
| (c) External economies | (iii) Arise when cost per unit depends on size of the firm |
| (d) Economies of scope | (iv) Arise when cost per unit depends on the size of the industry, not the firm |
CODES
| (a) | (b) | (c) | (d) | |
| 1 | (ii) | (iv) | (i) | (iii) |
| 2 | (i) | (ii) | (iii) | (iv) |
| 3 | (ii) | (iii) | (iv) | (i) |
| 4 | (iv) | (iii) | (ii) | (i) |
