
CTET Solved Paper - RTET Feburary 2011 Paper2


- Option : C
- Explanation : Follows from the definition of bar graph.
You must be logged in to post a comment.

- Option : B
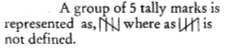
- Explanation :
You must be logged in to post a comment.
You must be logged in to post a comment.
- Option : B
- Explanation : Each of 1.5, 2.1, 2.7 and 3.3 is multiple of 3 and can be represented on the graph by choosing a scale of ~ 30 thousand per unit.
You must be logged in to post a comment.
You must be logged in to post a comment.
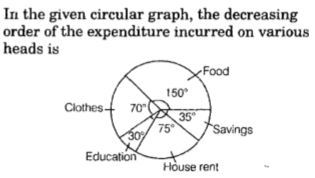
- Option : B
- Explanation : As 150° >75° >70° >35° > 30°
So, food> House rent> Clothes> Savings> Education.
You must be logged in to post a comment.
You must be logged in to post a comment.
120. 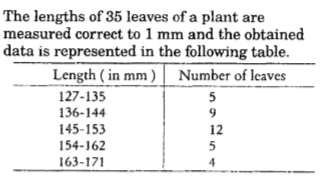
Is it correct to conclude that maximum number of leaves are?
- Option : C
- Explanation : Maximum number of leaves (12) fall in the range 145 - 153 mm.
Midpoint of this range = (145 + 153)/2 = 149 mm.
So, it can be said that maximum number of leaves are 149 mm in length on an average.
You must be logged in to post a comment.
You must be logged in to post a comment.

You must be logged in to post a comment.