Manag., January-2017-Q34


- Option : A
- Explanation : Probable Error and Standard Error of Coefficient of Correlation
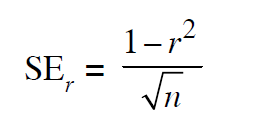
The probable error (PE) of coefficient of correlation indicates extent to which its value depends on the condition of random sampling. If r is the calculated value of correlation coefficient in a sample of n pairs of observations, then the standard error SEr of the correlation coefficient r is given by
The probable error of the coefficient of correlation is calculated by the expression:
PEr = 0.6745
Thus, with the help of PEr we can determine the range within which population coefficient of correlation is expected to fall using following formula:
p = r ± PEr
Where p (rho) represents population coefficient of correlation.
Remarks
1. If r < PEr then the value of r is not significant, that is, there is no relationship between two variables of interest.
2. If r > 6PEr then value of r is significant, that is, there exists a relationship between two variables.
Normality and the Sampling Distribution of the Mean
1. For most population distributions, regardless of shape, the sampling distribution of the mean is approximately normally distributed if samples of at least 30 are selected.
2. If the population distribution is fairly symmetrical, the sampling distribution of the mean is approximately normal for samples as small as five.
3. If the population is normally distributed, the sampling distribution of the mean is normally distributed, regardless of the sample size.
