
line1 Q2
Instructions:
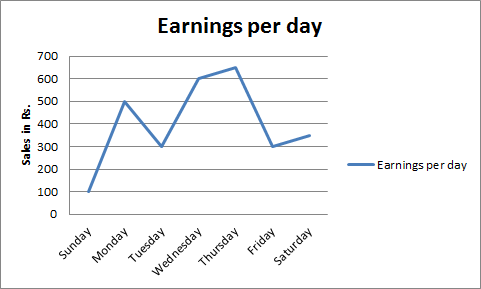
Directions. The graph given below represents the variations in earnings in rupees over a week. Study the graph and answer questions given below


Accessibility
Oversized Widget
Saved in this browser. Nothing changes for anyone else.