
line1 Q1
What is Line Graph or Line Chart ?
- A Line Graph is a way of plotting data points on a line. It is generally used to show trends in data.
- It helps managers to take faster decisions.
- One can represent a large amount of data using a simple Line Chart.
What are Line Chart Examples ?
In this section you will find sufficient number of Line Chart Examples to make concepts clear.
Instructions:
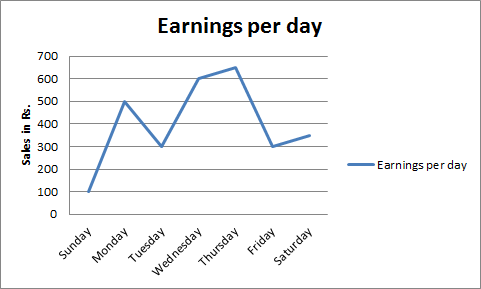
Directions. The graph given below represents the variations in earnings in rupees over a week. Study the graph and answer questions given below


Accessibility
Oversized Widget
Saved in this browser. Nothing changes for anyone else.