24june2019 paper1 Q34
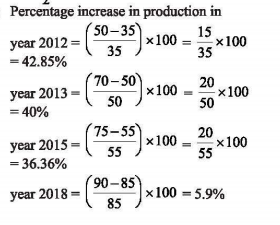
Consider the following table that shows the production of fertilizers by a company (in 10000 tonnes) during the year 2011 to 2018. Answer the question based on the data contained in the table:
| Year | 2011 | 2012 | 2013 | 2014 | 2015 | 2016 | 2017 | 2018 |
| Production of Fertilizers: | 35 | 50 | 70 | 55 | 75 | 60 | 85 | 90 |