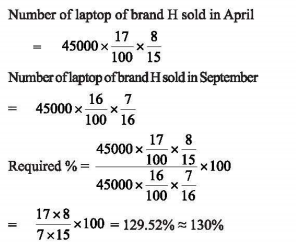
20june2019 paper1 Q33
Consider the following two tables (I and II) that show the percentage-wise distribution (%) of the number of laptops sold by a shopkeeper during a period of six months from April to September 2018 and the ratio between the number of Laptops sold of brand HP (H) and brand DELL (D) during the same six months. A total of 45000 laptops have been sold during these six months Study these tables I and II and answer the questions that follow
| I. Sale of laptops Month wise | II. Laptops Brand Ratio | ||||
| Name of Month | % of Laptops | Name of Month | Ratio | ||
| April | 17 | H | D | ||
| May | 22 | April | 8 | 7 | |
| June | 25 | May | 4 | 5 | |
| July | 8 | June | 3 | 2 | |
| August | 12 | July | 7 | 5 | |
| September | 16 | August | 7 | 8 | |
| September | 7 | 9 | |||
.