Directions. The circle graph given below shows the spending of a family on various items and its savings a year
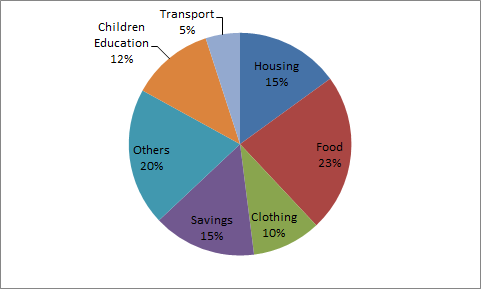
If the total income of the family is Rs. 75000, the expenditure on children's education is
| A. | Rs.9000 |
| B. | Rs. 900 |
| C. | Rs. 7500 |
| D. | Rs. 750 |
|
Option: A Explanation : Click on Discuss to view users comments. |
What percentage of the income was spent on transport and other items?
| A. | 25% |
| B. | 20% |
| C. | 30% |
| D. | 32% |
|
Option: A Explanation : Clearly 25o of income was spent on transport and other items. Click on Discuss to view users comments. |
Out of the total of Rs. 75000, the difference of the expenses on Housing and Transport was
| A. | Rs. 8500 |
| B. | Rs. 7500 |
| C. | Rs. 8200 |
| D. | Rs. 6350 |
|
Option: B Explanation : Difference of expenditure on Housing & Transport = (15-5)% of Rs. 75000 = Rs. 7500 Click on Discuss to view users comments. |


