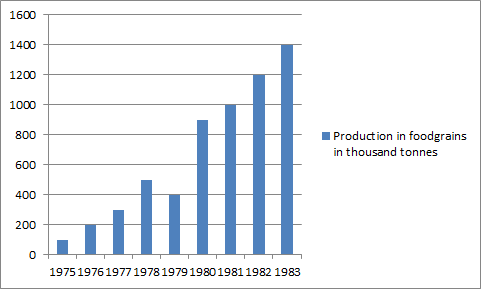
Directions: The bar chart showing the food production in India during 1975 to 1983 is shown in the following figure. Answer the questions below
Considering the measures given on the Y-axis, the production figures must be related to
| A. | the production of any of the cereals |
| B. | the production of the cash crops |
| C. | the production of any of the food items |
| D. | total food production during the year |
|
Option: D Explanation : Click on Discuss to view users comments. |
How may times food production has increased from 1975 to 1983
| A. | 2 |
| B. | 1.5 |
| C. | 4 |
| D. | 5 |
|
Option: D Explanation : Click on Discuss to view users comments. |
Which one of the following does not come under the methods of data classification?
| A. | Qualitative |
| B. | Normative |
| C. | Spatial |
| D. | Quantitative |
|
Option: C Explanation : Click on Discuss to view users comments. |
Whichh one of the following is not a source of data?
| A. | Administrative records |
| B. | Population census |
| C. | GIS |
| D. | Sample Survey |
|
Option: D Explanation : Click on Discuss to view users comments. |
Which one of the following methods is best suited for mapping the distribution of different crops as provided in the standard classification of crops in India?
| A. | Pie diagram |
| B. | Chorochromatic technique |
| C. | Isopleth technique |
| D. | Dot method |
|
Option: B Explanation : Click on Discuss to view users comments. |


