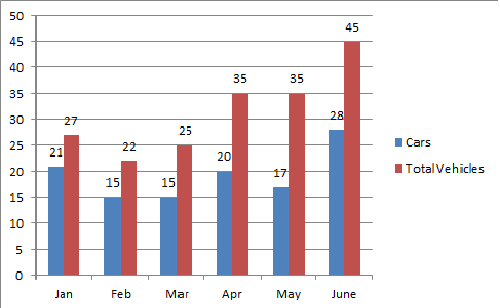
The following bar diagram shows the registration of cars and total vehicles during first six months of the year 1998 :
Study the above diagram and answer the questions (1 to 3) given below:
What was the increase in registration of vehicles other than cars from January to April 1998?
| A. | 5000 |
| B. | 10000 |
| C. | 15000 |
| D. | 9000 |
|
Option: D Explanation : Registration of other vehicles in January = 6000 Registration of other vehicles in April = 15000 Therefore, Increase = (15000-6000) = 9000 Click on Discuss to view users comments. Arti said: (1:48pm on Tuesday 17th January 2017)
How can we get to know number of registration of vehicle in January
heena said: (9:30pm on Friday 23rd June 2017)
arti mam digits are same as shown in fig. just multiply it with 1000.
MADHURI said: (11:43pm on Tuesday 30th January 2018)
Y TO MULTIPLY IT WITH 1000?
|
What was the percentage increase in registration of cars from May to June 1998?
| A. | 11% |
| B. | 39.28% |
| C. | 64.7% |
| D. | None |
|
Option: C Explanation : Registration of cars in May = 17000 Registration of cars in June = 28000 Increase = ((11000/17000)*100)% = 64.7% Click on Discuss to view users comments. mariya said: (2:13pm on Tuesday 27th June 2017)
why difference is divided by 17000
|
What was the number of vehicles other than cars registered in March 1998?
| A. | 5000 |
| B. | 10000 |
| C. | 40000 |
| D. | 37000 |
|
Option: B Explanation : Number of vehicles other than cars registered in March 1998 = (25000-15000) = 10000. Click on Discuss to view users comments. |


